
Housing Progress Report—None that is Real—Progress, that is
City Conversation #48: What passes for a report to Council these days

April 27, 2022—Yesterday, City Council reviewed the 158-page “2021 Housing Progress Report, Housing Needs Report, and Update on Housing Targets Refresh,” which was provided for review about 10 days ago. Following are my comments to the Council meeting where it was reviewed:

The unexplained “pipeline” is highlighted in red
I am speaking in opposition to this report.
I was initially excited when I electronically cracked open this 158-page Report. I assumed a report of this size and title would answer the questions I have been struggling with for at least the past year:
What progress are we making in housing, especially affordable housing?
What housing are we producing and what’s still missing from the mix?
How well are we doing and how can we do better?
Sadly, this report answers none of these questions in a researched, defensible way. My time as a citizen speaking to Council is very limited (to five minutes), so I will get right to it.
On the matter of what progress are we making in housing, especially affordable housing?, the answer can only be we just don’t know. The 2021 Housing Approvals section of the Report, starting on Page 20, has nice bar charts but, unlike reports prepared by housing experts such as CMHC and most university academics with suitable credentials, the basis for these bar charts is not explained—there is no way for anybody to determine how the charts were generated. So I must set these aside—you should too, until and unless their basis is explained, referencing data that a member of the public like me can access and understand.
Regarding the question of what housing are we producing and what’s still missing from the mix?, the Report early on injects a bit of mystery—Figure 2 above from Page 10 of the Report tells us there is a 10-year “pipeline” from 2021 through 2031 that appears to include 51,000 units of housing—but nowhere is the origin of this number explained. I actually searched the number as well as the word “pipeline” across the entire report, assuming the 150+ pages of the Report would educate me about what is portrayed as an important estimate of work in progress—except it doesn’t.
Rather than giving up entirely, I instead looked at my Homes for Whom database, which tracks the more than 380 spot rezonings commenced since the current Council was elected. My database exists because city staff will not provide Councillors, let alone ordinary citizens, aggregate data around spot rezonings. It does not include the incremental housing that is built when a homeowner or developer adds a laneway home, duplex or secondary suite, or redevelops within existing zoning regulations—my numbers just include the specific up-zonings that have arisen across the city.
After carefully reviewing my data, all of it extracted from the city’s own Shape Your City websites, I discovered different numbers:
Just over 22,000 homes have had their spot rezonings already approved by this Council—that’s a six year supply that’s not been built yet;
An additional 21,000+ homes have their spot rezonings in progress—that’s an additional six year supply that’s not been built yet;
So now we already have a 12-year supply of housing based on population projections by Metro Vancouver, CMHC and other experts who have made their data publicly available.
But we’re not done yet! In addition to the 12-year supply of spot rezoned homes approved or in process, we have:
Northeast False Creek; Senakw’; Jericho Lands; the Broadway Plan; and most recently that I am aware of, Skeena Terrace.
The impacts of Council’s approved Streamlining Rental and Making Home initiatives.
Together these projects will provide at least 57,000 homes by their proponent’s and city staff’s own estimates, albeit over a more than 10 year horizon—in total, this represents at least an additional 26-year supply.
Add those all up and it comes to exactly 100,000 homes with spot rezonings completed, in progress or tabled but not formally applied for as yet—that’s a 38-year supply not including already zoned incremental development, laneways, duplexes and secondary suites.
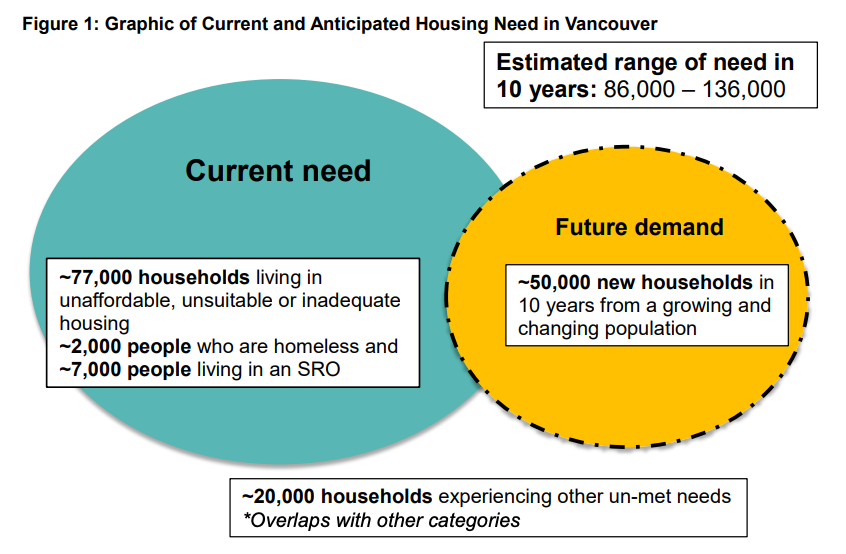
One quarter of Vancouver Households are apparently in unaffordable, unsuitable or inadequate housing
Finally, regarding How well are we doing and how can we do better?, I only wish I knew. The Report offers little help, none of it explained, footnoted or otherwise informative. Figure 1 above from Page 8 of the Report asks me to believe that fully 1/4 of Vancouverites are living in unaffordable, unsuitable or inadequate housing, without any credible evidence beyond because we say so! The same Figure 1 expects me to believe that future housing demand in Vancouver will be 50% more than any projections by Metro Vancouver or Statistics Canada. I know full well that we have significant housing issues, but over estimating them without factual evidence helps nobody.
In conclusion:
The 51,000 unit pipeline in Figure 2 has no attribution, is presumably designed to make us feel guilty because it is below aspirational targets that only exist because staff says so!
Council has already approved or has in progress 12 years worth of spot rezoned housing, more than the Report’s 10-year horizon proposal based on projections by data-based experts such as Metro Vancouver, CMHC and Statistics Canada—we’ve already got more in the pipeline than we need for the next 10 years.
The raft of rezonings just below the horizon represent enough housing to last until 2060, NOT including the Vancouver Plan;
BUT, barely 20% of that entire 38-year supply is identified as any kind of rental, and that 20% includes social housing, below market rental, secured and market rental—we’re committing ourselves to 12 years worth of mostly the wrong kind of housing, with no affordability guarantees in exchange for massive up-zonings.
I urge you to send this Report back to staff and insist they return with something that will not embarrass Council and upset its electors. Thank you!
The Report was approved with amendments which have not yet been made available on the city’s Council website.
Today’s question: Are you happy with the 2021 Housing Progress Report and its methodology? Why or why not?
I read and respond to all comments made below. If you enjoyed this post, consider becoming a free subscriber to City Conversations at

Brian Palmquist is a Vancouver-based architect, building envelope and building code consultant and LEED Accredited Professional (the first green building system). He is semi-retired for the moment, still teaching and writing, so not beholden to any client or city hall. These conversations mix real discussion with research and observations based on a 40+ year career including the planning, design and construction of almost every type and scale of project. He is the author of the Amazon best seller “An Architect’s Guide to Construction.” He is also a member of team for a livable Vancouver, a new political party dedicated to restoring a livable Vancouver starting with the 2022 civic election. City Conversations are generally congruent with TEAM policy, so if you like the ideas that I’m writing about, please consider joining TEAM.
Good job tackling this very (unnecessarily) complicated issue! However, if we are going to empty the swamp we have to avoid getting caught in swamp fever. And I have to tell you, my head is swimming right now.
I'm going to start with Figure (1) because it is foundational to Fig.(2) and the rest of the discussion:
(a) How is 'Housing Need' estimated?
(b) How is 'Growth' measured (maybe, quote the just released census)?
(c) What it the total number of households in Vancouver? And while we are at it, how many are priced/rented above the affordability threshold (federal definition)? How many rent below the monthly social assistance check? (In the DTES it is common place for rent to take the full check. In some SRO residents just sign it over). There are probably 3 filters that we need to pass the data through: market; affordable; supportive. Those three boxes apply to the whole data set.
That's just baseline stuff. You have done a great job of explaining your research:
(d) Total number of spot rezoning in the CoV: 100,000 homes; 38 year supply.
I contacted Stats Canada directly, and due to decreases over the Covid years, the 2016-2021 annual growth figure for Vancouver can remain at 1% Growth (b) above.
Assuming you have the numbers right (they look good to me) 100,000 homes over 38 years means 2,650 homes per year is the (a) Housing Need above.
'(c)' Would be a handy number to have, but I don't see it.
The 25% Unaffordable, I agree with you, is a joke. You have to press for answers on these figures!
However, you must quote:
(e) CMHC
(f) Metro Vancouver
(g) Stats Canada
If we are to get to the real picture. As these numbers either support of come into conflict with one another, we will start to know just what the heck is going on.
The final numbers to provide are stock market growth numbers. Here the 'quants' are about how much Vancouver REITS are expected to growth this year.
An AE LePage analyst last February published what I take to be a good representation of this other kind of 'growth': growth in the investment portfolio of Vancouver housing paper or 'mutual funds'.
(h) 12% for Houses
(i) 8% for Condos.
That's not the whole picture, but it is a very robust data set.
"Ten Year Pipeline" (quoted as 51,000 in Fig. 2, should be 10 x (a) = 26,500.
By this measure:
• The plans are out by 200%—twice the capacity in the pipe than needed to HOUSE people (stock market aspirations, of course are different thing).
By your 100,000 units 'found' on the city website:
• The plans are out by 400%—four times the needed capacity is in the pipe.
As you well point out... there is more coming. The BS Corridor Plan and the New City Plan are coming to Council in May and June.
What this analysis still leaves out is the other poser: what is this brand of growth management doing to the markets?
I think we can answer that based on living in this city for more than four decades: land values are being inflated by Council giving away density.
Note that while this is BAD for those looking to live affordably in Vancouver, it is not BAD across the board. Developers are making out like bandits with bags of money. Government is complicit by collecting development fees & revenues.
What about the livability of the city? What is the result, besides land price inflation, of dropping towers into neighborhoods like so many bunker busting bombs?
Stay tuned folks.... I'm feeling another 'conversation' coming up!
This is a frightening report! For 15 years I, along with many others from the small business community in Vancouver regarding commercial property taxes, found the exact same approach being used by city staff for reporting to Council. Nothing has changed. The tail is most certainly wagging the dog (or sheep).
Ed Des Roches